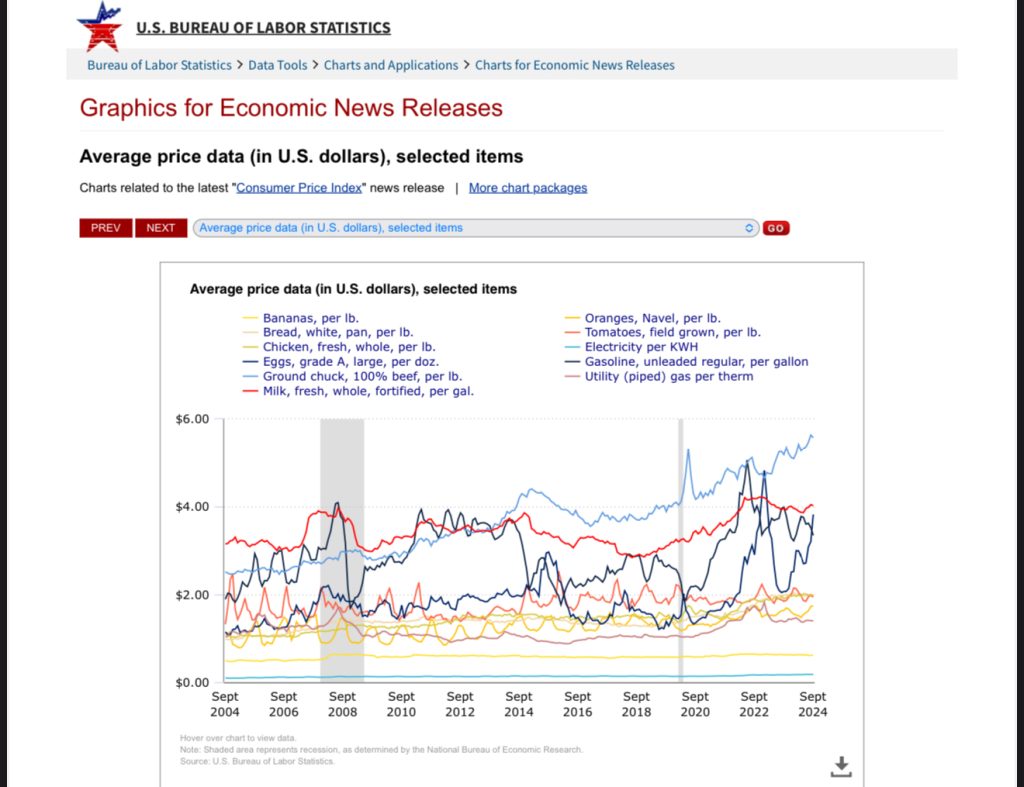
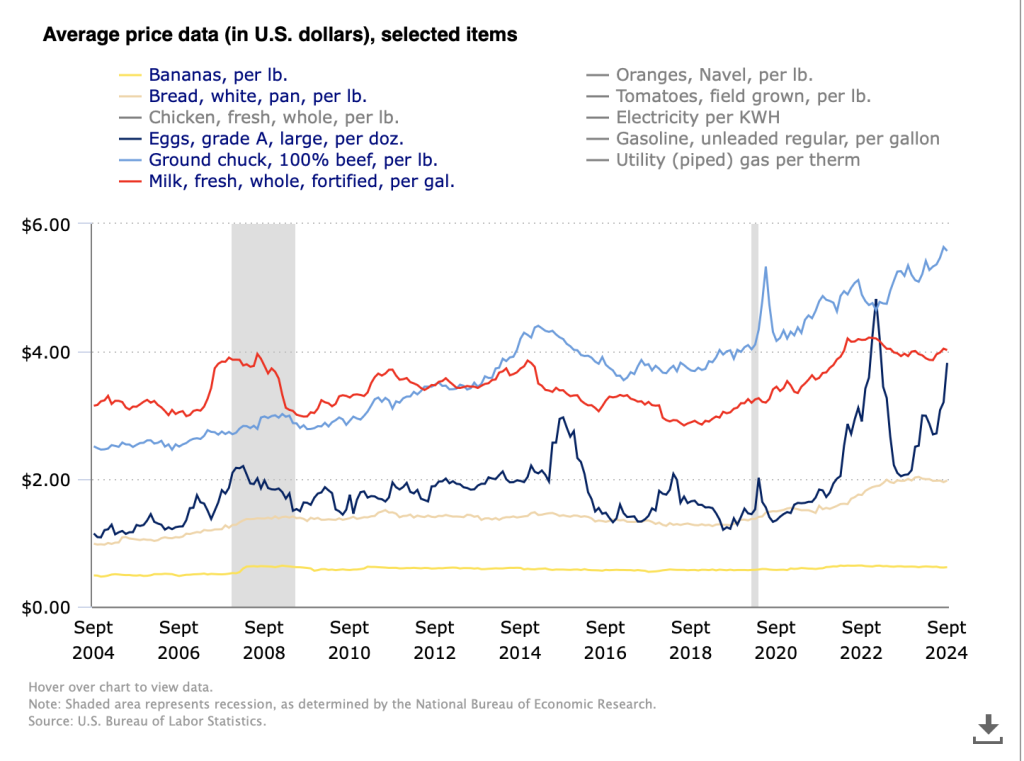
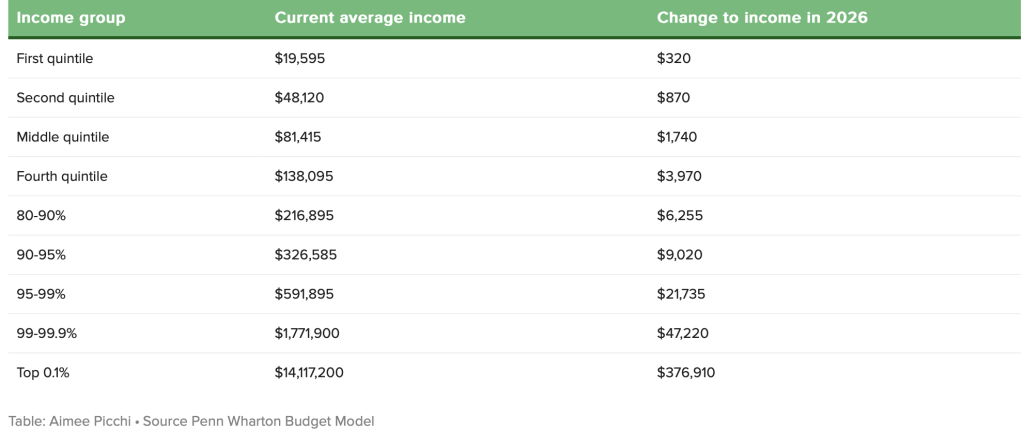
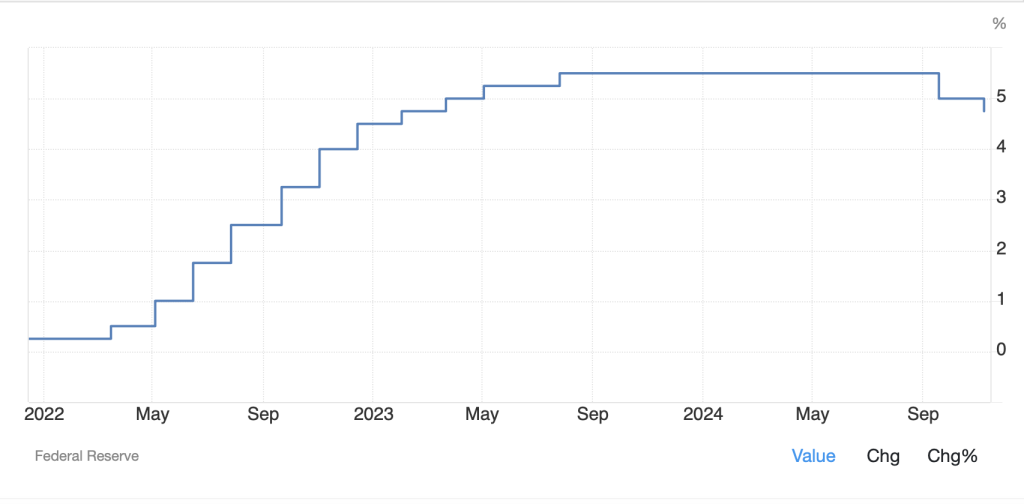
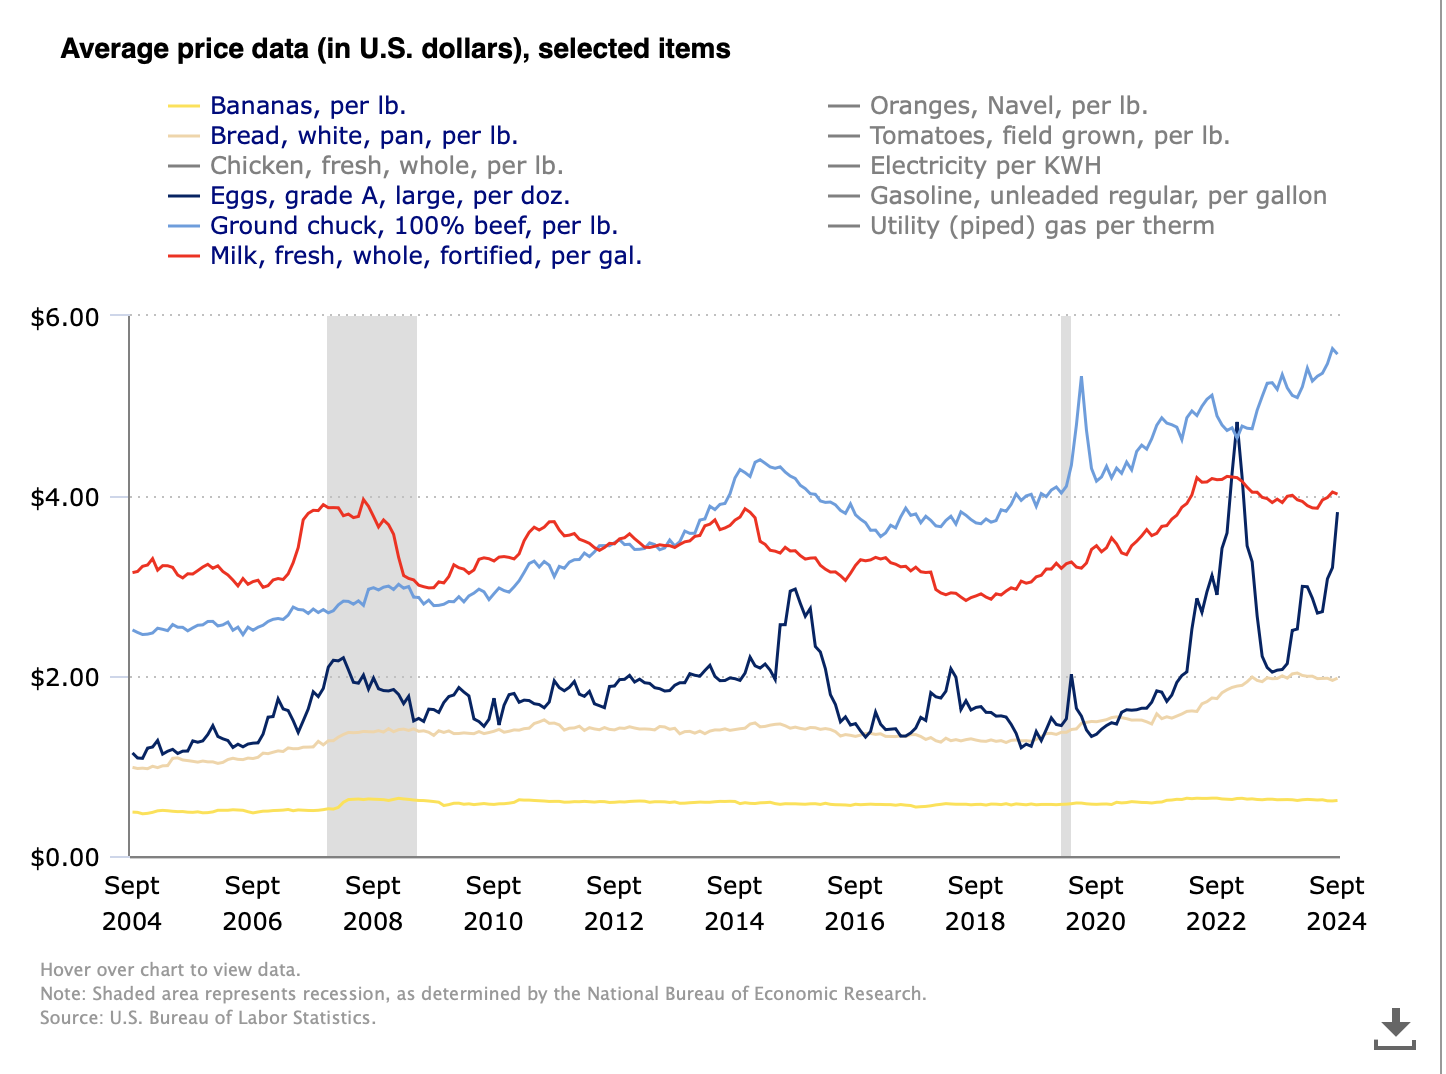
Below is an overview of key indicators from sources like the Bureau of Labor Statistics (BLS,) the Consumer Price Index (CPI,) and the Federal Reserve providing a November 2024 snapshot of the U.S. economy. Consumer price data has been included to highlight the cost of essential staples such as eggs and bread. Additionally, a chart outlining Trump’s proposed tax cuts is included for reference. Donald Trump is proposing to extend his 2017 tax cuts and give new breaks to retirees and tipped workers. But the biggest beneficiaries would be high-income Americans, according to a new analysis from the Penn Wharton Budget Model.
Data provides a foundation for understanding what’s actually happening, allowing us to see past rhetoric and focus on measurable outcomes. Numbers can reveal whether policies are effective, how resources are being allocated, and whether certain claims hold up under scrutiny. This objective approach enables citizens to make more informed decisions, assess accountability, and foster transparency. I hope that we can revisit these data to hold politicians accountable. (Plus I am an economy nerd.)
And now the Trump Tax Cut [Source]
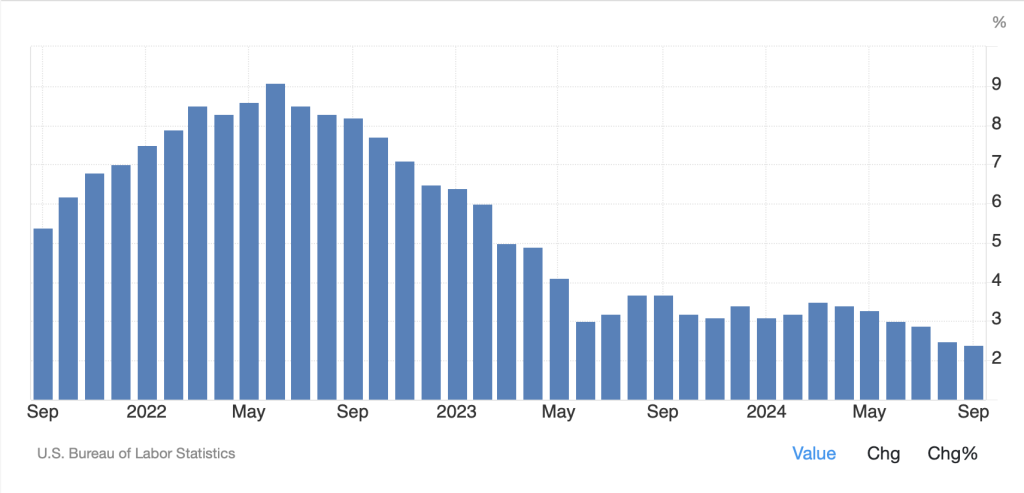
United States Inflation Rate [Source]
Please share this with friends and family, especially those in lower and middle-class tax brackets.
And, yes, the “tax cuts” won’t do much for them (look at the data.)


Leave a Reply